
A mill quotes eight weeks, then the vessel misses its berth and your block sits idle. The buffer you set on a fixed multiplier was never sized for that spread.
Plan safety stock for marine angle steel by measuring the spread of each lead-time stage, not just the average, then applying a service-level factor: safety stock equals Z times the square root of average lead time times demand variance, plus average demand squared times lead-time variance.
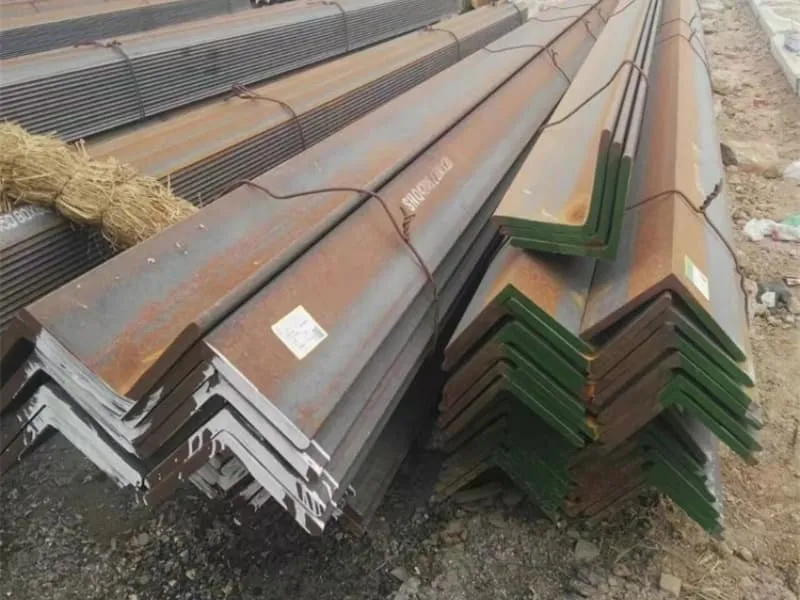
Most yards I visit have a number on a whiteboard for their marine angle steel buffer, and almost none of them can tell me how that number was made. It is usually last year’s figure, or a percentage someone inherited. That works until a mill pushes your rolling slot back two weeks and the whole block sequence shifts.
Why Does a Fixed Safety-Stock Multiplier Fail When Marine Angle Steel Lead Times Move?
Every yard has a rule of thumb. The most common one multiplies daily usage by lead time by 1.3. It is easy to defend in a meeting, and it is blind to the only thing that actually hurts you.
A fixed multiplier treats lead time as a constant, so two suppliers with the same average lead time but very different reliability get the same buffer. That is backwards. The supplier who swings by three weeks needs a larger safety stock than the one who is always within three days, even when both average forty days.
The rule of thumb measures the wrong thing
Daily usage times lead time is pipeline stock. It is the tonnage you need in the channel just to keep the line fed while a normal order travels. Multiply it by 1.3 and you have pipeline stock plus a margin. That is a legitimate planning number for a yard with no data, but it is not a safety stock, and calling it one causes two problems.
The first problem is that it makes your buffer scale with distance rather than risk. A yard buying from a Chinese mill on a thirty-day sea leg gets a large number, and a yard buying from a local stockist on a five-day truck leg gets a small one, even when the local stockist is the unreliable one. The second problem is that when someone asks why the buffer is 250 tonnes, the honest answer is “because the lead time is long”, which is not a reason. The reason should be “because this size has a standard deviation of demand of 1.5 tonnes a day and our supplier’s delivery date moves by a week”.
Lead time is six clocks, not one
On a marine angle steel order from Liaocheng to a Gulf yard, the calendar between deposit and gate-in is not one process. It is six or seven, and each one has its own spread. Here is what we see on a typical 200-tonne order of equal-leg angle, ABS grade A, 12 m lengths.
| Stage | Typical duration | Observed range | What moves it |
|---|---|---|---|
| Order confirmation and deposit | 2 days | 0–5 days | Spec gaps, payment route, PO corrections |
| Mill rolling slot and production | 14–21 days | 10–35 days | Order book depth, size mix, heat lot grouping |
| Testing and certificate issue | 5 days | 3–14 days | Surveyor attendance, retest, marking |
| Inland trucking to port | 1–2 days | 1–4 days | Truck availability, weather, port appointment |
| Port wait and berth | 4 days | 2–21 days | Vessel rotation, congestion, blank sailing |
| Sea freight to Dammam | 20 days | 18–35 days | Routing, transshipment, Red Sea diversions |
| Customs clearance | 5 days | 3–28 days | Document errors, inspection, certificate of origin |
| Inland delivery to yard | 3 days | 1–14 days | Trucking capacity, gate hours, yard access |
Add the typical column and you get about 54 days. Add the variances and you get a spread that is far wider than 54 plus or minus a week. The certificate stage alone can swallow nine extra days, and customs can swallow twenty-three. When a buyer tells me his lead time is “about eight weeks”, he is quoting the middle of a distribution that runs from six weeks to fourteen.
The certificate is the gate nobody timestamps
I keep coming back to one question when a buyer says the mill promised a date: promised what? Rolled, or certified? Those are different events, and the gap between them is where most of the unpleasant surprises live.
Classification society material needs surveyor attendance for mechanical testing and marking. If the witness is not booked, the steel can be finished, stacked and perfectly good, and still not shippable. I have watched a finished bundle sit for eleven days waiting for a signature. The rolling mill was not late. The paperwork was.
So when you build the lead-time record, do not record one date. Record the date the mill confirmed the slot, the date the bundle was rolled, the date the certificate was signed, and the date it was loaded. The distance between rolled and signed is a number you can manage. The distance between “eight weeks” and reality is not.
How Do You Measure Lead Time Variability for Marine Angle Steel?
You cannot calculate a standard deviation from a feeling. The good news is that you do not need software. You need twelve months of purchase orders and a spreadsheet with the right columns.
Record eight timestamps per receipt: PO issue, supplier acknowledgement, mill rolling date, certificate date, vessel departure, vessel arrival, customs release, and yard gate-in. Then take the difference between the same pair of stamps across at least twenty receipts. The standard deviation of that difference is your lead-time variability, and it is usually far larger than planners assume.
Build the log before you build the buffer
A purchase order history with only an order date and a goods receipt note will not give you this. Most ERP systems hold the receipt date and the PO date, and nothing in between, which is why planners fall back on averages. Ask your supplier for the intermediate dates. A decent export desk already has them, because they are chasing the same vessel you are.
The log needs one row per receipt, not one row per purchase order. A 400-tonne order split into three shipments is three observations, and you will usually find that the first shipment is the slowest and the third is the fastest. Averaging them into one row hides exactly the pattern you are trying to see.
| Field | Example | Why it matters |
|---|---|---|
| PO number and revision | PO-26-0417 rev 1 | Revision changes reset the clock |
| Size and grade | L100×100×10, ABS A | Variability differs by size family |
| Quantity | 62 t | Small lots wait for a rolling campaign |
| PO issue date | 2026-03-02 | Start of the clock |
| Mill rolling date | 2026-03-19 | Production stage, 17 days |
| Certificate signed | 2026-03-27 | Certification stage, 8 days |
| ETD Qingdao | 2026-04-02 | Port stage, 6 days |
| ETA Dammam | 2026-04-23 | Sea stage, 21 days |
| Customs release | 2026-04-29 | Clearance stage, 6 days |
| Yard gate-in | 2026-05-02 | Final leg, 3 days |
| Total | 61 days | The number you actually plan with |
Separate the two kinds of uncertainty
There are two inputs, and they are not interchangeable. Demand variability is how much your weekly consumption of a given angle size moves. Lead-time variability is how much the delivery date moves. The formula needs both, and most yards only measure the first, badly.
Demand for marine angle steel is lumpy by nature. A shipyard does not consume 3.6 tonnes every day. It consumes nothing for a fortnight while a block is being fitted, then forty tonnes in a week when the frames are set. If you calculate a daily standard deviation across that pattern, you get a number that is technically correct and practically useless, because the swings are driven by block release, not by random variation.
The fix is to measure demand at the resolution you actually plan at. If your production plan releases work in weekly packages, measure weekly consumption per size and convert the standard deviation to daily by dividing by the square root of five working days. If you plan by block, measure consumption per block and treat the block as the period. Whichever you choose, write it in the header of the sheet, because a standard deviation without its period is just a number.
Cap the outliers instead of deleting them
One shipment in your history will be a disaster. A port strike, a missing certificate of origin, a vessel that skipped the rotation. If you leave it in, it inflates your buffer for years. If you delete it, you learn nothing.
My preference is to cap it. Take anything beyond two standard deviations and pull it back to the two-sigma value, then recalculate. You keep the signal that the route can go wrong, without letting one bad quarter set your inventory policy for the next three years. Note the capped observations in a comment column so the next planner knows what you did.

How Do You Calculate Safety Stock by Size for Marine Angle Steel?
Now the arithmetic. It is one formula, and it takes ten minutes per size once the log exists.
Safety stock equals Z multiplied by the square root of average lead time times demand variance, plus average demand squared times lead-time variance. Z comes from your target service level. Reorder point equals average daily demand times average lead time, plus that safety stock.
The formula and what each term does
The full expression is:
Safety stock = Z × √(L × σd² + d² × σL²)
Where L is the average lead time in days, σd is the standard deviation of daily demand in tonnes, d is the average daily demand in tonnes, and σL is the standard deviation of lead time in days. Z is the service-level factor from the normal distribution.
The first term inside the root is demand risk. The second term is supply risk. Whichever term is larger tells you where to spend your effort. If demand variance dominates, tighten your material takeoff and block release. If lead-time variance dominates, work on the supplier, the surveyor booking, or the routing. That diagnostic value is the reason to use the full formula rather than the shortcut version that assumes a fixed lead time.
| Service level | Z value | Suitable for |
|---|---|---|
| 90% | 1.28 | Long-tail sizes, cut from remnant, easy to substitute |
| 95% | 1.65 | Standard sizes with a second source available |
| 99% | 2.33 | Grade and size locked to one block, no substitute |
| 99.9% | 3.09 | Critical path material where a stop costs a shift |
A worked example that shows where the risk sits
Take L100×100×10 in ABS grade A, consumed at 3.6 tonnes per working day, with a daily standard deviation of 1.5 tonnes. Average lead time is 54 days with a standard deviation of 7 days. Target service level is 95%, so Z is 1.65.
Demand term: 54 × 1.5² = 54 × 2.25 = 121.5.
Supply term: 3.6² × 7² = 12.96 × 49 = 635.0.
Sum: 756.5. Square root: 27.5. Multiply by 1.65: 45.4 tonnes.

Eighty-four percent of that variance came from the delivery date, not from consumption. Raise the service level to 99% and the buffer goes to 64 tonnes. Cut the lead-time standard deviation from 7 days to 4 by booking the surveyor earlier and holding a firm vessel slot, and the buffer falls to 28 tonnes. That is 17 tonnes of working capital released by a scheduling change, not a purchasing negotiation.
Now run the same numbers for a second supplier with a 40-day average lead time. Supplier A delivers at 40 ± 3 days; Supplier B delivers at 40 ± 15 days. The old multiplier gives both 187 tonnes, because 3.6 × 40 × 1.3 does not know the difference. The formula gives Supplier A 23.7 tonnes and Supplier B 90.4 tonnes. Supplier B needs nearly four times the buffer for the same average date. If you are choosing between those two quotes, that difference belongs in the comparison, and it is worth real money over a year.
Reorder point, and the in-transit trap
Once you have the buffer, set the trigger: reorder point equals average daily demand times average lead time, plus safety stock. For the example above, that is 3.6 × 54 + 45.4, or 239.8 tonnes. When the on-hand balance hits 240 tonnes, the next order goes out.
The trap is what counts as on-hand. Steel that has been rolled but not certified is not available. Steel sitting at the port waiting for a berth is not available, not in any useful sense, because you cannot cut it. Steel in a container on the water is definitely not available. If your ERP counts purchase orders as incoming stock from the PO date, your reorder point will never trigger, and you will discover the gap on the day the block is ready.
At the yard I use a simple rule: an angle size counts as available only when it is on the ground, tagged with a heat number, and matched to a certificate. Everything else goes in a separate column called “in transit, not available”. It looks pedantic until the first time it saves a block.
When Should You Change the Buffer as the Market Moves?
A buffer is a decision, not a fixture. The number that was right when your mill quoted six weeks is wrong when it quotes fourteen, and the mistake most yards make is discovering that in the middle of a hull.
Review the buffer monthly for your top ten sizes and quarterly for the rest. Move it when a supplier’s quote moves, when a surveyor booking slips, when a route changes, or when a new block sequence changes consumption. A safety stock that has not been reviewed in a year is not a policy, it is a leftover.
Read the mill’s quote as a signal
A mill’s quoted lead time tells you more about the market than any price index. Commodity as-rolled angle in a normal market comes back at four to eight weeks. When the same enquiry comes back at twelve to sixteen weeks, the mill is booking beyond its current campaign, and your order will sit in a queue that is longer than the number suggests. That is the moment to raise the buffer, not after the first late shipment.
I watch the same pattern every year before Chinese New Year. The mills slow down for the holiday, every buyer wants material landed before it, and a four-week quote becomes five without anyone doing anything wrong. The yards that plan for it book slots in October and hold an extra two weeks of critical sizes through January. The yards that do not spend February on the phone.
| Signal | Normal | Stretched | Buffer action |
|---|---|---|---|
| Mill quote | 4–8 weeks | 12–16 weeks | Add one to two weeks of cover on A-class sizes |
| Surveyor booking | Same week | Two weeks out | Move certificate stage into the critical path |
| Port berth wait | 3–5 days | 2–3 weeks | Switch to a direct sailing or a different load port |
| Allocation notice | None | Partial shipments | Split the order across two mills |
| Route change | Direct | Transshipment | Recalculate σL, not just the average |
Two sources beat one bigger buffer
There is a limit to what inventory can fix. If your only source for a size is a mill with a fourteen-week queue and a surveyor who visits twice a month, no buffer will make you flexible. Adding a second source, even at a higher unit price, does more for availability than another hundred tonnes on the ground.
The pattern that works for the yards we supply is a primary mill for volume and a stockist or a distributor for the urgent gaps. The primary mill gets the annual volume and the better price. The secondary source is used maybe four times a year, at a premium, when a block moves forward. The premium is almost always smaller than the cost of a stopped assembly line, and it keeps the primary mill honest on dates.
Place the buffer where the bottleneck is
Buffer in the wrong location is expensive decoration. If your pretreatment line is at a different site from the main yard, a buffer at the main yard does not help the pretreatment line. I have seen yards hold eight weeks of angle in a central store and still stop, because the three days of material that the profile-cutting shop needed were on a truck.
For marine angle steel the practical split is a small buffer at the point of consumption, sized at three to five days, and the calculated buffer at the main store. The point-of-consumption stock is not there to absorb lead-time variance. It is there to absorb internal handling variance, which is a different problem with a different fix.
One more habit worth borrowing: tell your supplier what the buffer is for. When Gulf Metal Solutions in Dammam started sharing its block sequence with us, we stopped shipping everything at once and started timing the lots to the assembly order. Their on-site buffer came down, and their line never waited. The tonnage did not change. The timing did.

| Planning approach | Fixed multiplier | Lead-time-aware |
|---|---|---|
| Inputs used | Daily usage, average lead time, 1.3 | Usage mean and sigma, lead-time mean and sigma, service target |
| Two suppliers, same average date | Identical buffer | Supplier A 23.7 t, Supplier B 90.4 t |
| Response to a 12-week mill quote | No change | Buffer raised on A-class sizes before the late shipment |
| Response to a booking improvement | No change | Buffer recalculated, capital released |
| Typical failure mode | Too much of the wrong size, too little of the critical one | Requires 20 receipts of clean timestamp data |
| Review trigger | Annual budget cycle | Monthly for top ten sizes |
| Best use | New yard with no history | Any yard with a purchase order archive |
Conclusion
Measure the delivery spread before you size the buffer. Two suppliers with the same average lead time can need four times different stock. Only the variance tells you which.